Worksheet on distance-time graph & velocity-time graph – Q&A
This post presents a Q&A worksheet covering distance-time graph and velocity-time graph. Before you try to solve these, you may read our posts on the distance-time graph (d-t graph) and the velocity-time graph (v-t graph).
Worksheet on distance-time graph
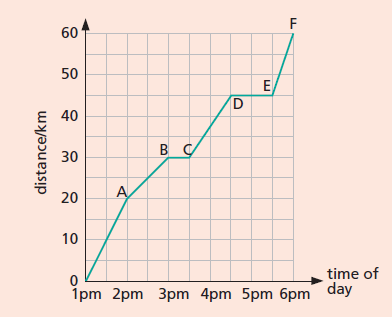
1 ) The distance-time graph for a girl on a cycle ride is shown in Figure 1.
a) How far did she travel?
b) How long did she take?
c) What was her average speed in km/h?
d) How many stops did she make?
e) How long did she stop for altogether?
f) What was her average speed excluding stops?
g) How can you tell from the shape of the graph when she travelled fastest? At which stage did this happen?
2) The graph in Figure 2 represents the distance travelled by a car plotted against time.
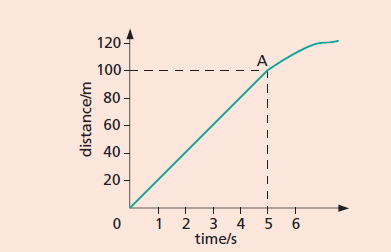
a) How far has the car travelled at the end of 5 seconds?
b) What is the speed of the car during the first seconds?
c) What has happened to the car after A?
d) Draw a graph showing the speed of the car plotted against time during the first 5 seconds.
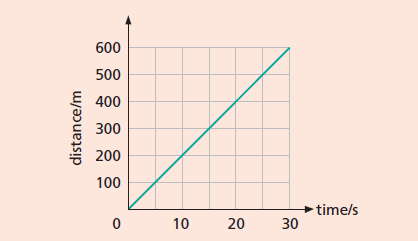
3) The distance-time graph for a motorcyclist riding off from rest is shown in Figure 3.
a) Describe the motion.
b) How far does the motorbike move in 30 seconds?
c) Calculate the speed.
Worksheet on velocity-time graph
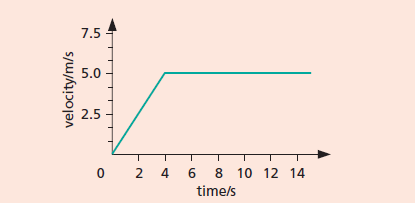
4) Figure 4 shows an incomplete velocity-time graph for a boy running a distance of 100 m.
a) What is his acceleration during the first 4 seconds?
b) How far does the boy travel during (i) the first 4 seconds, (ii) the next 9 seconds?
c) Copy and complete the graph showing clearly at what time he has covered the distance of 100 m. Assume his speed remains constant at the value shown by the horizontal portion of the graph.
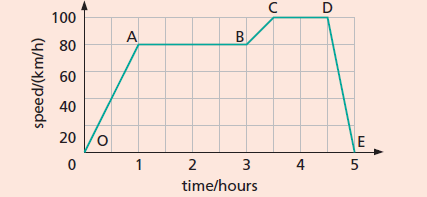
5 ) The approximate velocity-time graph for a car on a 5-hour journey is shown in Figure 5. (There is a very quick driver change midway to prevent driving fatigue!)
a) State in which of the regions OA, AB, BC, CD, DE the car is (i) accelerating, (ii) decelerating, (iii) travelling with uniform velocity.
b) Calculate the value of the acceleration, deceleration or constant velocity in each region.
c) What is the distance travelled over each region?
d) What is the total distance travelled?
e) Calculate the average velocity for the whole journey