
The velocity-time graph & speed-time graph – comparison
Here, we will find the differences between the velocity-time graph & speed-time graph. As an example, we will compare the velocity-time and the speed-time graphs for a ball being thrown up into the air.
Differences between the velocity-time graph & speed-time graph
A speed-time graph may have some similarities with a velocity-time graph, but these 2 are conceptually different. Also, there are a few important differences between these two graphs.
1 ) The big difference is that velocity-time graphs can have negative regions to show something traveling in the opposite direction. But, the speed-time graph has no negative region.
2 ) The area under a velocity-time graph represents the displacement of an object. Displacement, s, of an object with uniform acceleration can be found using: s = (1/2)(u + v) t
=> displacement= average velocity x time
You can find the total distance traveled by an object using: distance traveled = average speed × time. Therefore the area underneath a speed-time graph is the distance traveled.
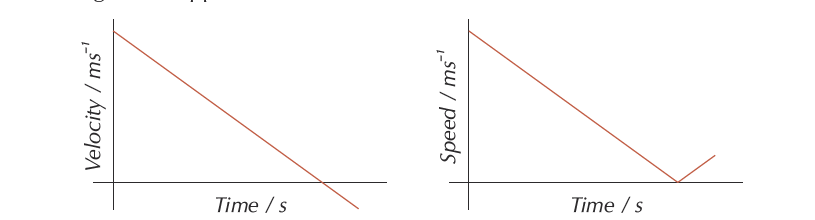
As an example, let’s compare the velocity-time and the speed-time graphs for a ball being thrown up into the air.
compare the velocity-time graph & the speed-time graph for a ball being thrown up into the air
Velocity is a vector and speed is a scalar quantity. Hence, velocity will have a direction always.
When the ball slows down and starts falling, its velocity will become negative (upward direction taken as positive) but its speed will start increasing again. (see the figure below)
For velocity-time graphs, the areas under any negative parts of the graph count as ‘negative areas’, as they show the object moving the opposite way to whichever direction you took as being positive.