
The difference between a distance-time graph and a displacement-time graph (for a ball thrown vertically upwards)
Last updated on April 14th, 2021 at 04:51 pm
Here we will discuss and draw a distance-time graph and a displacement-time graph for a ball thrown vertically upwards. We know that Displacement is the distance in a given direction from a certain point. Now let’s consider a ball thrown directly upwards and caught when it returns.
If the ball rises to a maximum height of 5.0 m, on returning to the thrower its displacement from its initial position is zero. However, the distance it has traveled is 10.0m.
Here is a quick take on the differentiating points between the displacement-time graph and the distance-time graph for a ball thrown vertically upwards.
The gradient of the displacement-time graph gives us the velocity, whereas the gradient of the distance-time graph gives us the speed of the object.
In the displacement time graph, the displacement reaches a maximum value (when the ball is the highest point) and then reduces to zero (when the ball comes back to the ground).
But, in the distance-time graph distance never comes back to zero value, after the ball is projected. The distance traveled by the ball continues to increase even after the ball reaches the maximum height, so the distance-time graph line curves up.
The displacement time graph looks different as well from the distance-time graph due to the above-mentioned points.
Displacement-time graph for a ball thrown vertically upwards with explanation
The displacement of the ball changes with time as shown by Figure 1.
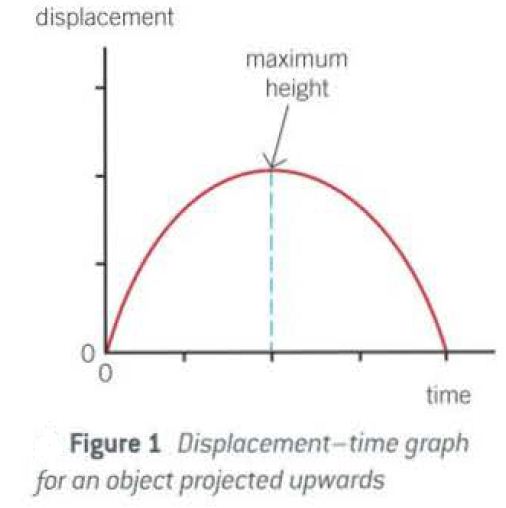
The gradient of the line in the displacement time graph (Figure l here) represents the velocity of the object.
•Immediately after leaving the thrower’s hand, the velocity is positive (velocity is a vector, for upward motion, it is taken as positive here) and large so the gradient of the graph is positive and large.
•As the ball rises, its velocity decreases so the gradient decreases.
•At maximum height, its velocity is zero so the gradient is zero.
•As the ball descends, its velocity becomes increasingly negative. Velocity is a vector. For upward motion, it is taken as positive here. Hence as the direction of the ball changes towards downwards, though the magnitude of the velocity increases due to downward gravity, its direction is taken as negative. Hence we said that during downward motion the velocity becomes increasingly negative.
That means the gradient of the displacement-time graph becomes increasingly negative during downward motion. This also means that the ball is coming closer to the ground (initial point of throwing).
As a result, with the descending ball, displacement of it also falls towards zero. So the line also curves down (fig 1)
Please note that, at the same time, as the ball descends speed of the ball increases (it’s a scalar, so no consideration of the direction of motion).
Distance-time graph for a ball thrown vertically upwards with explanation
The distance travelled by the object changes with time as shown by Figure 2.
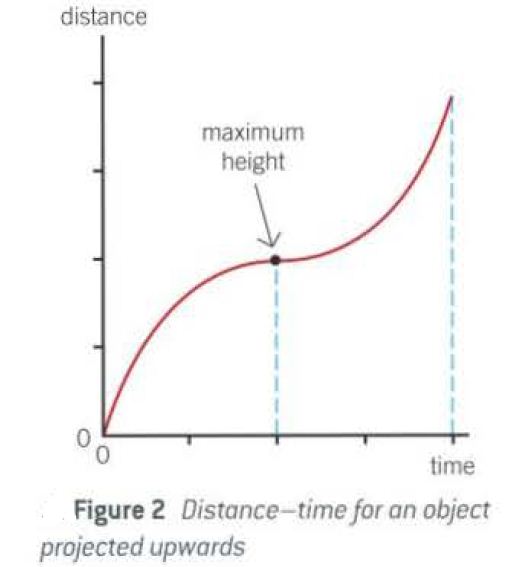
The gradient of this line in the distance-time graph represents the speed.
From projection to maximum height, the shape is exactly the same as in Figure l.
After the maximum height is reached, the distance traveled by the ball continues to increase with increasing speed (under acceleration), so the gradient of the line curves up, just opposite to Figure I.
Difference between the displacement-time graph and distance-time graph – Summary
The first halves of the displacement-time graph and distance-time graph of a ball thrown vertically are the same, but the difference is visible only after the ball reaches the maximum height (in the second half of the graphs).
Remember that, the gradient of the displacement-time graph is velocity which is a vector. But the gradient of the distance-time graph is speed which is scalar.
In the second half (when the ball is falling) of the displacement-time graph, the gradient of it (velocity) is increasingly negative. But in the second half of the distance-time graph, the gradient of it(speed) is increasingly positive.
This makes all the difference between the 2 graphs for a ball thrown vertically upwards.
Here is a table that lists down the differences between the displacement-time graph and the distance-time graph.
| Displacement-Time graph | Distance-Time graph |
|---|---|
| The gradient of the displacement-time graph is velocity which is a vector. | But the gradient of the distance-time graph is speed which is scalar. |
| In the second half (when the ball is falling) of the displacement-time graph, the gradient of it (velocity) is increasingly negative. | But in the second half of the distance-time graph, the gradient of it(speed) is increasingly positive. |
| In the displacement time graph, the displacement reaches a maximum value (when the ball is the highest point) and then reduces to zero (when the ball comes back to the ground). | But, in the distance-time graph distance never comes back to zero value, after the ball is projected. The distance traveled by the ball continues to increase even after the ball reaches the maximum height, so the distance-time graph line curves up. |
So here we have studied the displacement-time graph and the distance-time graph and discussed individually their graph pattern. We also have discussed a few differentiating points between the two.
Hope you like the post and share it using the share buttons on this page. Bookmark this page and come back for more interesting topics.