
Distance-Time graph of various types with examples
Last updated on April 14th, 2021 at 05:19 pm
This post is to discuss the Distance-Time graph with a few examples. A distance-time graph is a graphical representation of “how something moves”, pointing to the distance of the object from the starting point and the time instant from the staring moment along two axes of the graph.
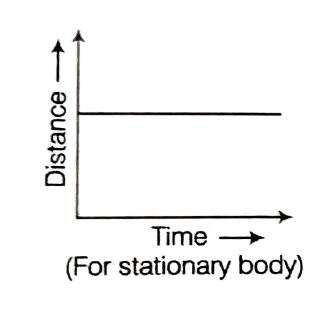
Distance-Time graph for stationary body
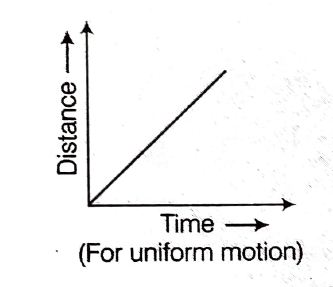
Distance-Time graph for uniform motion
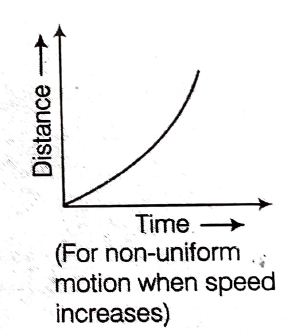
Distance-Time graph for nonuniform motion with acceleration
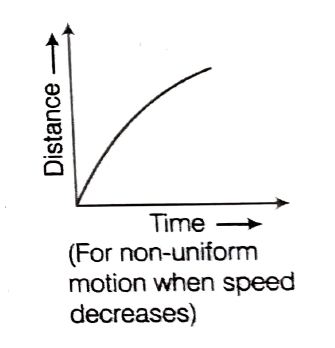
Distance-Time graph for nonuniform motion with retardation
Distance-Time graph with examples (Case study)
Case study (Example 1):
A bus traveled at a steady speed along the main road. After five minutes it reached the highway, where it increased its speed. After 10 more minutes, it has to stop due to congestion. How can you show this graphically using a distance-time graph?
We can show the above information in the form of a distance-time graph. To plot this specific example, this graph will have 3 sections, corresponding to 3 sections of the journey of the bus.
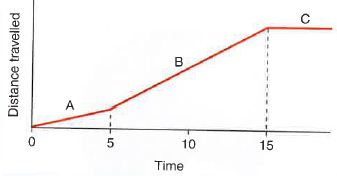
a) The graph slopes up gently (not steep), showing that the bus was traveling at a slow speed along the main road. Hence the change of distance (from the starting point) with respect to time is not fast.
b) As the bus reached the highway after 5 minutes, its speed increased. So the distance from the starting point now is changing faster than before. So the slope of the graph for this section is steeper.
c) After the bus stops due to congestion after running 10 minutes on the highway [that means, after 15 minutes of starting], there is no further change of distance from the starting point. So the graph for this section becomes flat with respect to elapsed time to show that the bus is stationary.