Extension-Load graph of Spring with Lab set-up and Analysis of the graph
Last updated on October 3rd, 2021 at 09:49 am
The Extension-Load graph of spring is a graphical representation of its extension versus applied load. This Extension-Load graph is drawn to see how the extension of a spring depends on the applied load. It is also known as the Load-Extension graph.
Here we will see
1. How to prepare the Lab set-up required to do this graph plotting,
2. How to take the experiment data set and
3. How to interpret a sample extension-load graph of a spring
Read these posts on Elasticity and Hooke’s Law for a quick revision.
How to set up the lab experiment to prepare an Extension-Load graph of a spring?

Here is a sample lab setup to carry out an experiment on the stretching of a spring. The spring is hung from a rigid clamp and its top end is fixed.
A weight or load is attached to the open end of the spring. The spring is suspended as shown in the diagram beside.
Now as the load is attached the spring extends i.e. its length increases. As the load is increased, the spring stretches, and its length increases.
It is observed that as the load is increased in regular steps, the length of the spring also increases in regular steps. At this stage, the spring will get back to its original length if the load is removed.
The observations are to be noted in a tabular form with 3 columns which will be used to draw the extension-load graph of the spring.
The 3 data columns are (1) Load in Newton (2) Current length of the spring in centimeter (3) Extension of the spring in centimeter. The first row will be for zero load i.e. with no load attached.
However, beyond a certain limit of the applied load, the spring becomes permanently stretched and will not return to its original length when the load is removed. Here we can say that the spring has been inelastically deformed.
Here is one such sample results table.
Result table for Extension-Load graph
| Load in N | Length in cm | Extension in cm |
|---|---|---|
| 0 | 24 | 0 |
| 1 | 24.6 | 0.6 |
| 2 | 25.2 | 1.2 |
| 3 | 25.8 | 1.8 |
| 4 | 26.4 | 2.4 |
| 5 | 27 | 3 |
| 6 | 27.6 | 3.6 |
| 7 | 28.6 | 4.6 |
| 8 | 29.6 | 5.6 |
Drawing Extension-Load graph
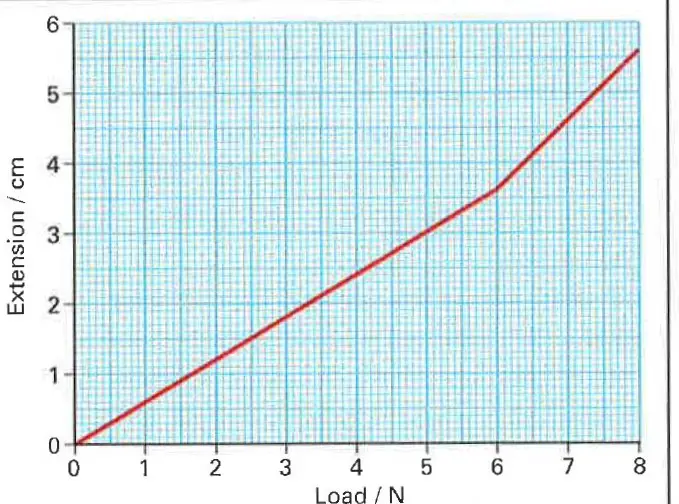
Now it’s time to draw the load versus extension graph for the given spring according to the experiment result set listed in the table in the previous section of this post.

Analysis of the Extension-Load graph
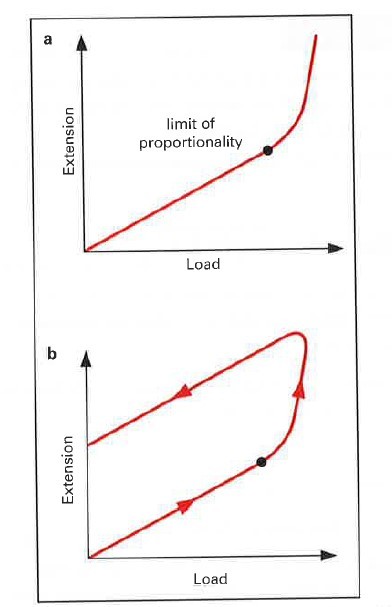
We have drawn extension versus load in a graph to find out how the extension of length depends on the applied load for a spring. We can observe that the graph has 2 visibly distinct parts.
1 ] In the beginning, the graph slopes up uniformly in a straight line up to a point. This means that the extension of length increases in equal steps as the load increases.
And when the load is removed the extension becomes zero and the spring gets back to its original length. This point is known as the limit of proportionality.
2 ] Then after a certain limit of the applied load, the graph bends. Here the extension is no more in equal steps with the load.
The spring here has become permanently damaged, as when the load is removed the extension doesn’t become zero and the spring doesn’t return to its original length.

(b) beyond the limit of proportionality, the extension is never zero even if the load is fully removed
Take Away
Here we have covered the concept of extension load graph of spring and the limit of proportionality. If you like this post share this using the share buttons on this page.
If you want to revise the fundamentals then read these posts on Elasticity and Hooke’s Law.
