The oscilloscope & its signal attribute, AC and DC graph
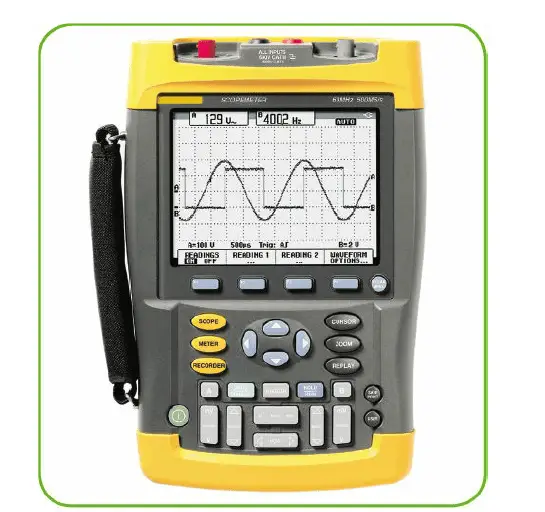
An oscilloscope is an instrument used to investigate electrical signals. The screen of the oscilloscope displays a trace of the electrical signal and in almost all cases this is a graph of potential difference versus time. Let’s discuss oscilloscope & its signal attribute, DC trace, and AC trace.
Oscilloscope DC trace
We can measure the potential of a DC trace very simply as the number of vertical squares, or divisions, multiplied by the number of volts per square.
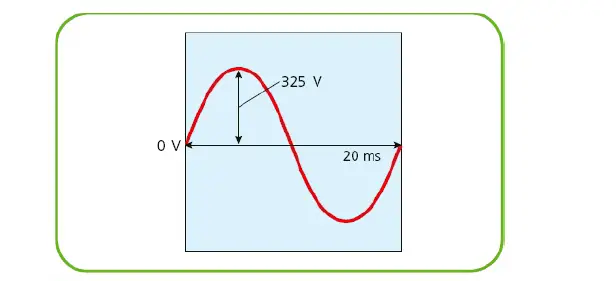
Oscilloscope AC trace
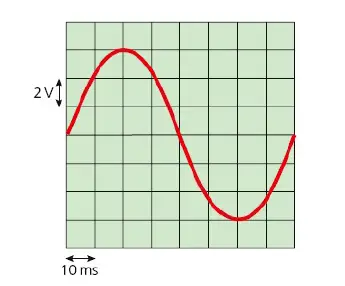
Similarly, we can measure the peak AC potential difference by first measuring the number of divisions from the middle of the trace to the top.
It is essential to confirm what the scale is and we are able to vary this using the dials on the front of the oscilloscope. The time is measured in the same way, using the horizontal divisions, and this allows us to measure both the frequency and period of the signal.
Solved or worked example on oscilloscope signal attribute
1 ) Find the following attributes of the signal shown in Figure 3 if the oscilloscope is set to measure 5 V per vertical division and 10 ms per horizontal division:
a) Vpeak
b) Vrms
c) period of the wave
d) frequency of the wave.
Solution:
a) The peak of the voltage is the distance from the center point to the top of a peak and the trace covers 2.5 divisions, so we can get the Vpeak.
Vpeak = 2.5 x 5 V = 12.5 V
b) The rms value is measured as Vpeak/√2 which gives us 8.8 V.
c) The wave, from peak to peak, takes four horizontal divisions, so t =4 x 10 ms = 4 × 0.01 s = 0.04 s.
d) The frequency of a wave is 1/t = 1/0.04 Hz = 25 Hz.
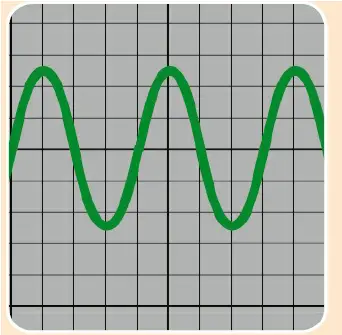
Exercise – reading oscilloscope trace
Look at the oscilloscope trace (Figure 4). What is:
a) the peak voltage
b) the RMS voltage
c) the frequency of the signal?