
Stress-Strain Graph & stress-strain analysis
Last updated on September 12th, 2023 at 04:53 pm
In this post, we will discuss how to interpret a Stress-Strain Graph to do a stress-strain analysis of a material.
The definition of the Young modulus states that the stress should be proportional to the strain if the material is deformed elastically. As per this understanding, we should get a straight-line graph if we plot stress against strain. But when the plotting is done, we do find a straight-line relationship for small stresses only.
Once the limit of proportionality is passed, the internal structure of the material starts to behave differently. As a result, the graph starts to curve.
The molecular structure of each material determines its response to increasing stress, Hence depending on the material under test, the stress-strain graph will go through various phases.
Finally, the stress will be too high, and the material will fracture. At this point, the line of the graph stops as no further data can be obtained about the sample material. In other words, when the material can’t withstand higher stresses, the graph can’t be plotted any further.
Stress-Strain Graph and its analysis
– The stress-strain graph for metal gives an idea of how the material behaves under different levels of stress
– The gradient of the straight-line position of the graph gives us the value of the Young Modulus.
Analysis of different portions of the stress-strain graph
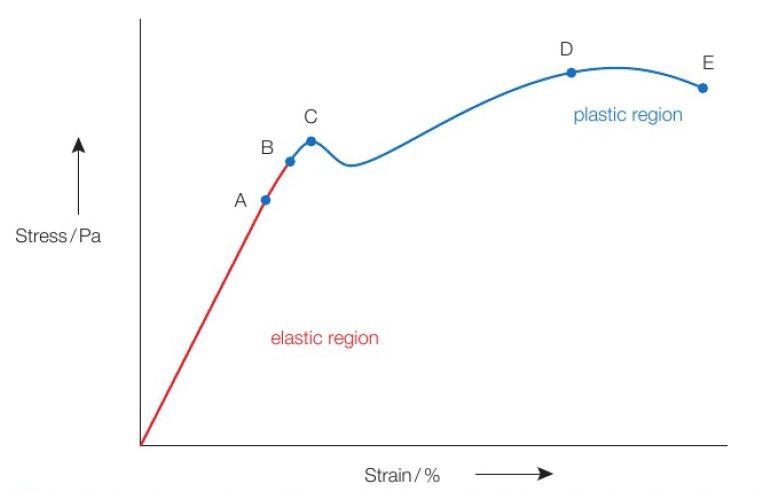
Let’s see how to interpret a Stress-Strain Graph to do a stress-strain analysis. (refer to figure 1 above)
1 ] In the straight-line portion from the origin to point A, the metal extends elastically. That means, during this phase the metal will come back to its original size and shape when the force (stress) is removed. The gradient of the straight-line portion of the graph is equal to the Young Modulus for the metal.
2 ] Point A is the limit proportionality. Slightly beyond this point, the metal may still behave elastically, but it can’t be relied upon to increase strain in proportion to the stress.
3 ] Point B is the elastic limit. Beyond this point, the material is permanently deformed and will not return to its original size and shape, even when the stress is removed completely.
4 ] Point C is the yield point. Beyond this yield point, the atomic substructure of the material is significantly reorganized and the material undergoes a sudden increase in extension.
5 ] Point D represents the highest possible stress within the material. It is called the Ultimate Tensile Stress (UTS).
6 ] Point E is the fracture stress or breaking stress. When the stress in the material reaches this point then the sample breaks.
Take Away
So here we have discussed the stress-strain graph and did the analysis of different parts of this graph. If you find this post useful please share this using the share buttons on this page.
Related posts you should read:
Hooke’s Law – stress and strain – Modulus of Elasticity
Poisson’s ratio, Strain energy & Thermal Stress
Extension-load graph of a spring