IGCSE Physics worksheets | GCSE Physics problems | Physics questions – worksheet
Last updated on October 2nd, 2023 at 04:09 pm
This post contains problems and questions covering GCSE physics and the IGCSE physics syllabus. These are compiled from GCSE Physics Specimen Assessment Materials. These are equally helpful to prepare for other boards and competitive examinations of different countries.
If you need the formula sheet or physics notes to refer to while attempting the worksheet below, you may browse through this portal to find related study material.
Use the search facility available on the pages. Also, I am going to add relevant links beside the worksheet questions, which will lead you to the relevant posts on this site.
IGCSE Physics worksheets | GCSE Physics problems & Questions
1 ] A car is pulled forward and begins to move along a road in the direction shown below. After a few seconds, the car is moving at a constant speed of 2m/s. Label clearly the two horizontal forces acting on the car.
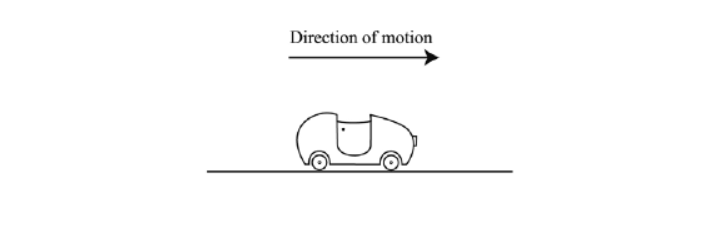
What can you say about the size of these two forces? _________________
The car then accelerates forward along the horizontal road. It takes 3seconds to increase its speed from 2m/s to 20m/s. Calculate the acceleration (rate of change of speed).
You are advised to show clearly how you get your answer.
Acceleration = ________________m/s^2
Suggested reading: IGCSE Force & Motion solved worksheet
2] The diagram shows an object moving in a circle.
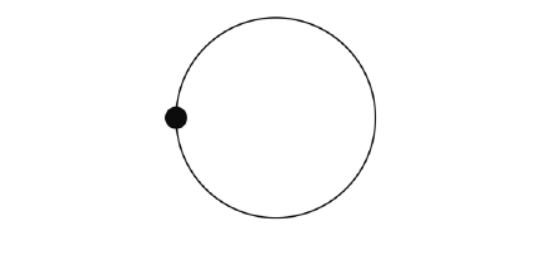
(i) On the diagram draw an arrow to show the direction of the centripetal force acting on the object.
Label this arrow F.
(ii) On the diagram draw an arrow to show the direction the object would move if this force were removed. Label this arrow v.
(iii) What happens to the size of this centripetal force if the mass of the object moving in the circle is increased?______________________________.
Suggested reading: Centripetal force Notes
3] (a) John wants to measure the density of a rock. He finds the volume of the rock using the apparatus shown below.
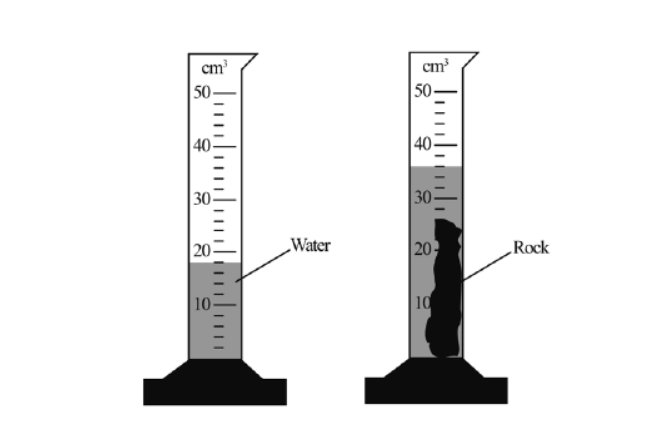
(i) What volume does the smallest division on the scale of the graduated cylinder show?
Volume =______________ .
(ii) Using data taken from the diagram calculate the volume of rock.
Volume =__________cm3 .
(iii) The mass of the rock was measured and found to be 36g.
Calculate the density of the rock. You are advised to show clearly how you get your answer. Remember to give the correct unit for density.
The density of the rock = _____________ .
(iv) John then measures the mass and the volume of a number of rocks. He then plots his results on a graph as shown below.
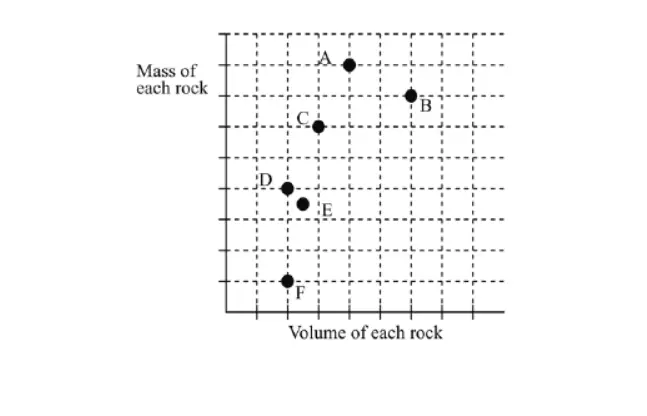
Which three rocks are made of the same material? Explain how you used the graph to arrive at this conclusion.
—————- .
Suggested reading: Density Q/A
4] (a) Kevin climbs a rope as shown in the diagram below.
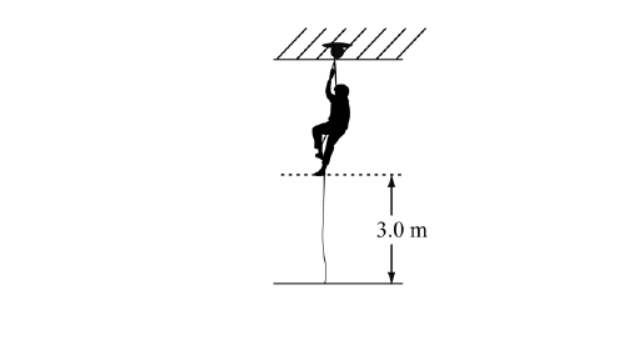
(i) He climbs a vertical distance of 3.0 meters and weighs 400 newtons. Calculate the work done by Kevin as he climbs the rope. You are advised to show clearly how you get your answer.
Work done =________________ J.
(ii) He takes 6.0 seconds to climb the 3.0 meter. Calculate the power generated by Kevin as he climbs the rope. You are advised to show clearly how you get your answer. Power = ________________ W.
(b) A nail gun fires a nail of mass 5g with a speed of 20m/s.
Calculate the kinetic energy of the nail as it leaves the gun. You are advised to show clearly how you get your answer.
Kinetic energy =________________ J
Suggested reading: Work Notes
Work Assignments
kinetic energy
5] To study the motion of a ball down a curved runway the apparatus shown below was set up. The ball is released at various points along the runway. The height above the table at each point is H. When it reaches the bottom it travels through the air and the point where it hits the floor is marked. The distance S from the bottom of the table to this point of impact is measured.
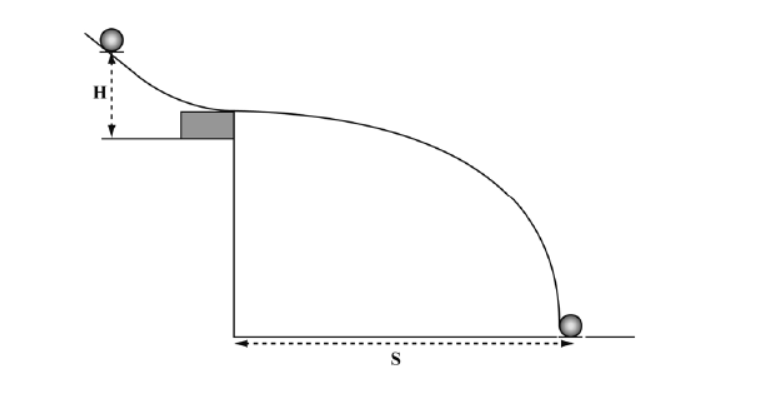
For each value of H, the ball was released three times and the value of S in each case was recorded. The measurements of the height H and the distance S were taken and are shown in the table below.
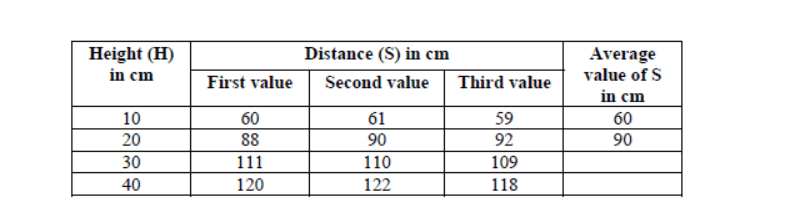
(a) Using the data given in the table calculate the average value of S for each height H. Write your answers in the spaces on the table. You may use the space below for your calculations. Two values have been calculated for you.
6] (a) A car sits at rest at the top of a roller coaster ride as shown in the diagram below. The brake is released and the car travels down the slope.
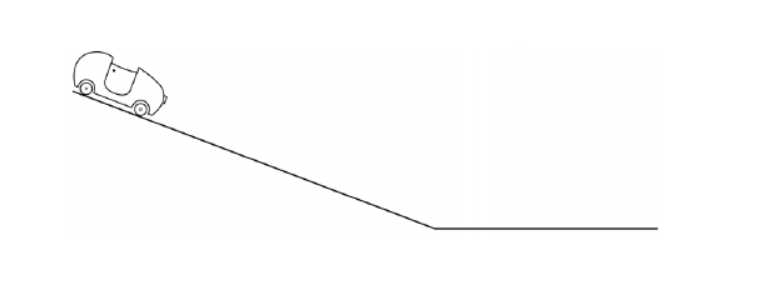
(i) On the diagram mark and label two forces acting on the car when it is moving.
(ii) At the bottom of the slope the car reaches a speed of 27m/s and continues along a horizontal track in which a braking system is operated. The deceleration of the car is 6m/s2. Calculate the time taken to come to rest. You are advised to show clearly how you get your answer. Time taken = ________________seconds .
(iii) The mass of the car is 1000kg. The force applied to the car by the braking system is 5000N. Calculate the additional frictional force provided by air resistance which brings the car to rest. You are advised to show clearly how you get your answer. Additional Frictional Force = ________________N
7] A skydiver jumps from an aircraft and for a time falls through the air without her parachute open. After a time she opens the parachute. The graph below shows how the velocity of a skydiver changes as she falls through the air. Her parachute opens at the time marked.
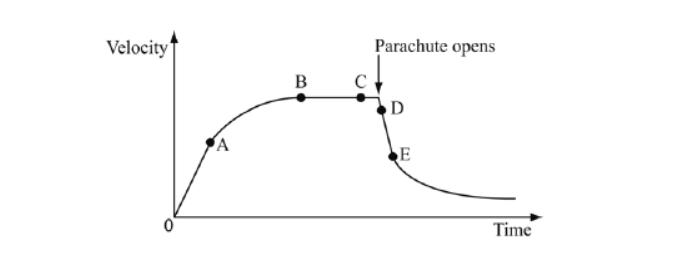
Describe and explain how her acceleration changes as she descends. You should concentrate on the periods OA, BC, and DE. In this question, you will be assessed on your written communication skills including the use of specialist science terms.
Suggested reading: Parachute motion
8] The diagram below shows a fish in a pond. A person looking into the pond sees the fish not at its true position but at the position shown in the diagram.
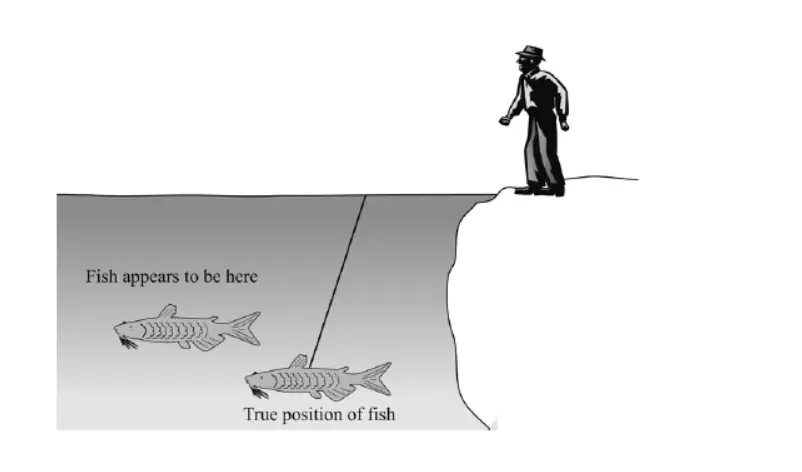
Complete the diagram to show how the man sees the fish. Draw an arrow on the given ray to show its direction.
9] The diagram shows a ray of white light being dispersed by a triangular glass prism.
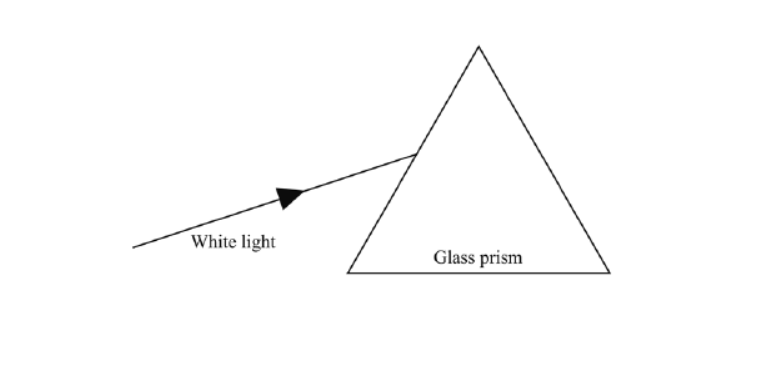
(i) On the diagram label the two colors at the top and bottom of the spectrum.
(ii) Explain, in detail, how this spectrum is produced by the prism. In this question, you will be assessed on your written communication skills including the use of specialist science terms.
Suggested reading: Prism & Dispersion
10] Sonar uses ultrasound to detect objects underwater. To measure the distance to the ocean floor, the submarine emits a pulse of ultrasound downwards.
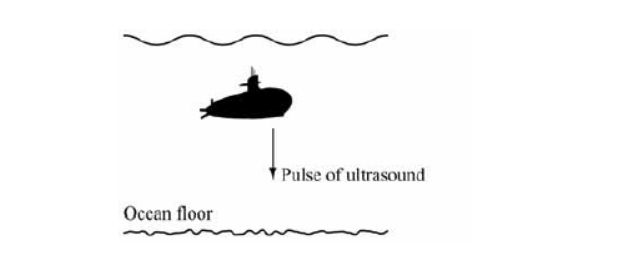
(i) The echo of this pulse is detected 0.4s after it was emitted. The speed of ultrasound in water is 1500m/s. Calculate the distance from the submarine to the floor of the ocean. You are advised to show clearly how you get your answer.
Distance to the ocean floor = ________________ .
(ii) Radar uses electromagnetic waves to detect the flying aircraft. Explain why Sonar would not be an appropriate method for this.
11] Three resistors are connected to a battery as shown in the circuit below.
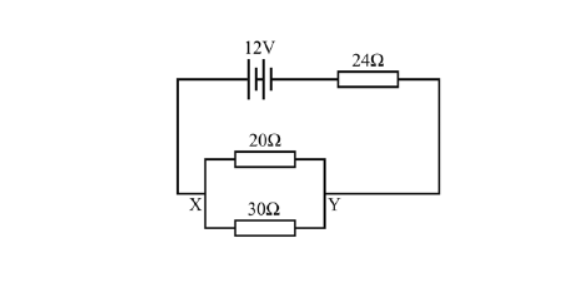
(i) Calculate the total resistance of the circuit. You are advised to show clearly how you get your answer.
Resistance = ________________ W.
(ii) Calculate the current through the 24W resistor. You are advised to show clearly how you get your answer.
Current = ________________ A.
(iii) A piece of wire of negligible resistance is connected between points X and Y. Calculate the current that flows through the 24W resistor. You are advised to show clearly how you get your answer. Current = ________________ A.
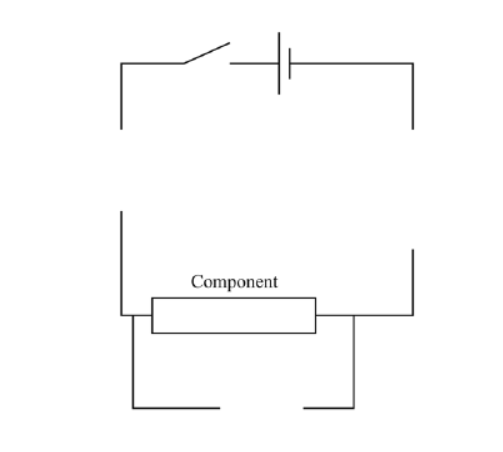
12] Complete the circuit diagram below by adding an ammeter, a voltmeter, and a device that will allow a pupil to investigate how the current passing through a particular component changes as the voltage across it is varied.
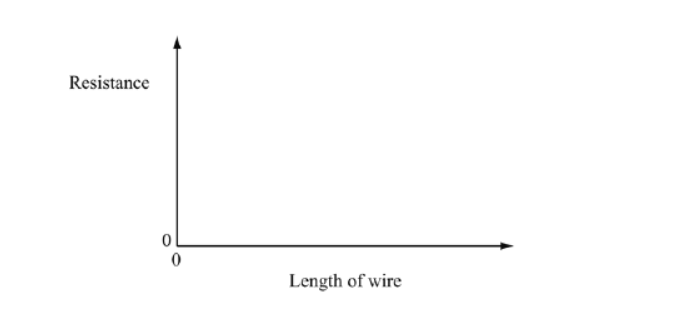
13] The resistance of a piece of wire depends on its length and its cross-sectional area.
On the axes below draw the shape of the graph that would be obtained if the resistance of different lengths of copper wire was measured, the cross-sectional area of each wire being the same.
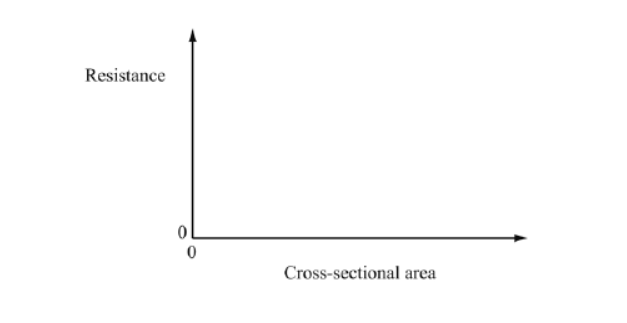
14] The resistance of a piece of wire depends on its length and its cross-sectional area.
On the axes below draw the shape of the graph that would be obtained if the resistance of copper wire of different cross-sectional areas was measured, the length of each being the same.