
Non-uniform acceleration on a velocity-time graph
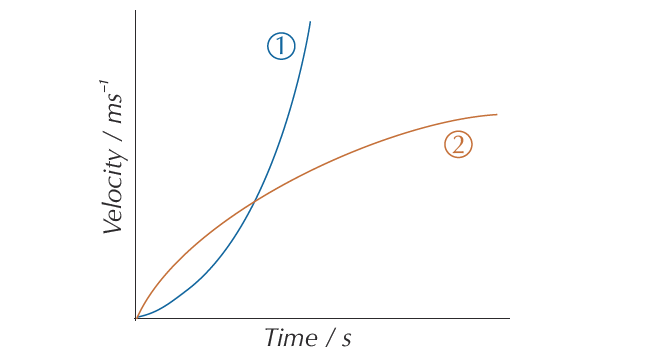
If the acceleration is changing, the gradient of the velocity-time graph will also be changing – so you won’t get a straight line. Increasing acceleration is shown by an increasing gradient — like in curve 1 below. Decreasing acceleration is shown by a decreasing gradient – like in curve 2 below.
How to find the acceleration of an object at a particular point on a velocity-time graph showing non-uniform acceleration?
For graphs like this, you can find the acceleration of an object at a particular point by drawing a tangent to the curve at that point and finding its gradient.
Example:
Find the acceleration shown by the velocity-time graph below at 60 seconds.
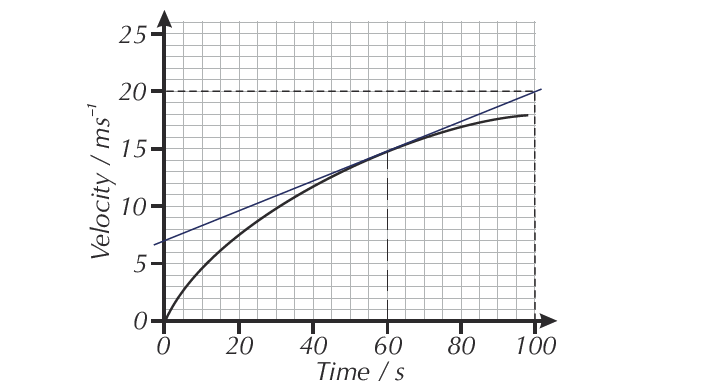
First, draw a tangent to the curve at 60 seconds.
Then find the gradient of the tangent: gradient =Δy/Δx=(20-7)/(100-0) = 13/100 = 0.13 m/s2
Read about the differences between uniform and non-uniform acceleration