Displacement-Time Graphs
Displacement-time graphs show an object’s position relative to its starting point over a period of time. They’re useful because they can be used to describe an object’s motion as well as find its velocity at a given point.
Plotting displacement-time graphs
Let’s see how to plot displacement-time graphs for moving objects.
The suvat equations can be used to work out values to plot.
Displacement is plotted on the y-axis and time on the x-axis.
Let’s solve a problem to understand the procedure of plotting a displacement-time graph.
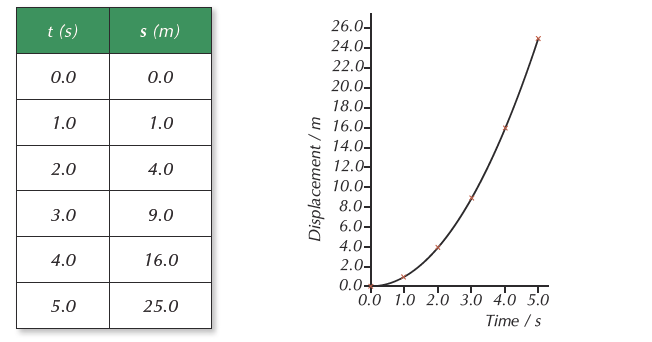
Plot a displacement-time graph for a panther who accelerates constantly from rest at 2.0 ms–2 for 5.0 seconds.
Solution:
Known values:
Acceleration = a = 2 ms–2
Initial velocity = u = 0
To find the displacement, we will use this suvat equation: s = ut + (1/2)at2
Here, u =0.
Hence, we can write: s = (1/2)at2 ………. (1)
Here, s = (1/2) 2. t2 = t2
Now pick values of t between 0 and 5.0 seconds
and work out the values of s at those points with s = t2: …then plot the graph:
Displacement is plotted on the y-axis and time on the x-axis.