
How to use graph paper to draw motion graphs?
Last updated on April 12th, 2021 at 04:51 am
How to use graph paper to draw motion graphs? – Plotting motion graphs is important if we want to learn motion physics well. In this tutorial, we will find out how to use a common graph paper to draw the motion graphs. For this, we will start by knowing what a graph is.
What is a graph?
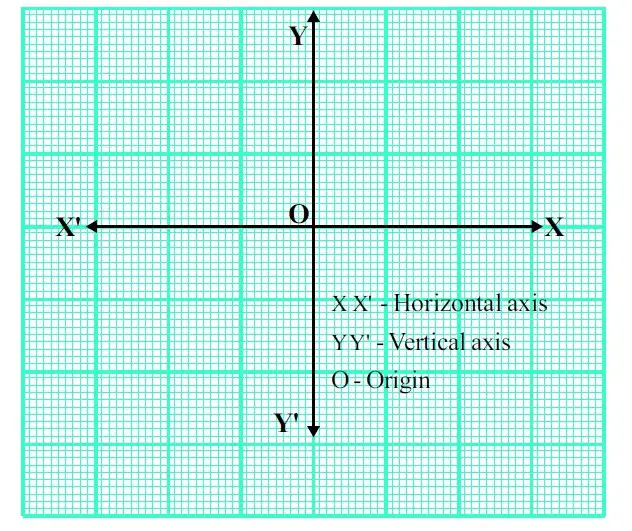
This is a two-dimensional diagram. It can be portrayed using two quantities. A graph has two axes. The horizontal axis is the ‘X’ axis and the vertical, ‘Y’ axis. The point ‘O’ is the origin. This is where X and Y axes meet. The axis towards the right from the origin is taken as the positive X-axis (OX) and to the left as the negative X-axis (OX’). In a similar way, OY and OY’ are considered as positive and negative axes.
How to use a graph to draw a position-time graph?
We can find out equations connecting the quantities represented by X and Y. Values obtained by these equations can be marked in a graph. Similarly, we can find out the values of the other equations using this graph.
Draw on a graph paper the axes X’OX and Y’OY.
Mark the values given in Table 1 on this graph. Join the markings. What is the nature of the graph obtained?
| Time (s) on X-axis | 0 | 2 | 4 | 6 | 8 | 10 |
| Position (m) on Y-axis | 0 | 10 | 20 | 30 | 40 | 50 |
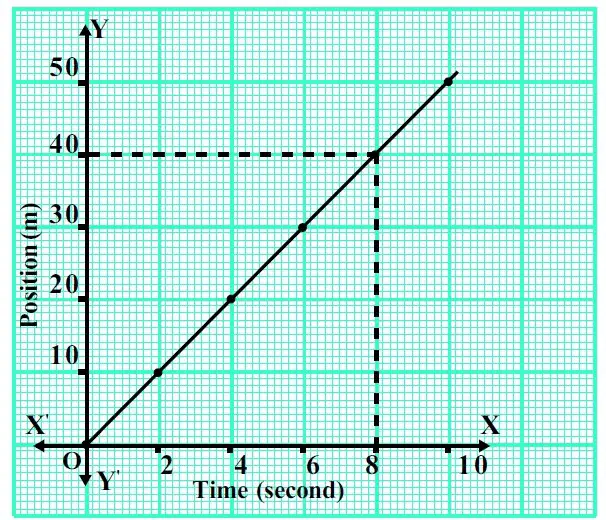
The graph has position along Y-axis and time along the X-axis. Now you need to plot each time-position pair data on the graph and connect those makings. You will get the time-position graph (a motion graph) as shown below.
How can we find the position of an object at a particular time from a position-time graph?
The position-time graph of a car is given. Let’s see how to find out from the graph the distance traveled by car in 8 seconds.
First, let’s find the position of an object at a particular time from a position-time graph (here 8th second).
– Draw a perpendicular from the X-axis to the position-time graph at the eighth second.
– From the point where the perpendicular meets the graph, draw another perpendicular to the Y-axis. The point at which this perpendicular meets the Y-axis is the distance traveled by car in 8 s.
As per diagram 2 above, the value is 40 m.
How to draw the speed-time graph of a moving object from a set of data?
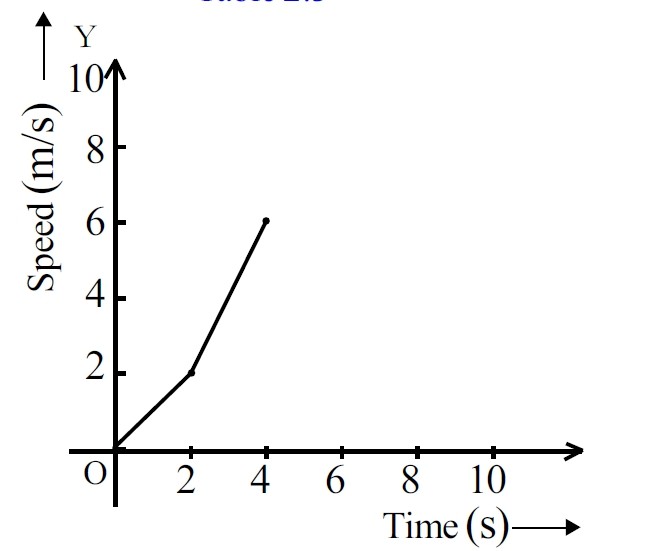
Let’s draw a speed-time graph from the data in the table below. A speed-time graph can be drawn by taking, on a convenient scale, time on X-axis and speed on Y-axis.
| Time(s) on X-axis | 0 | 2 | 4 | 6 | 8 | 10 |
| Speed (m/s) on Y-axis | 0 | 2 | 6 | 8 | 6 | 10 |
Here is the speed-time graph according to the given data set.
How to draw the velocity-time graph of a moving object from a set of data?
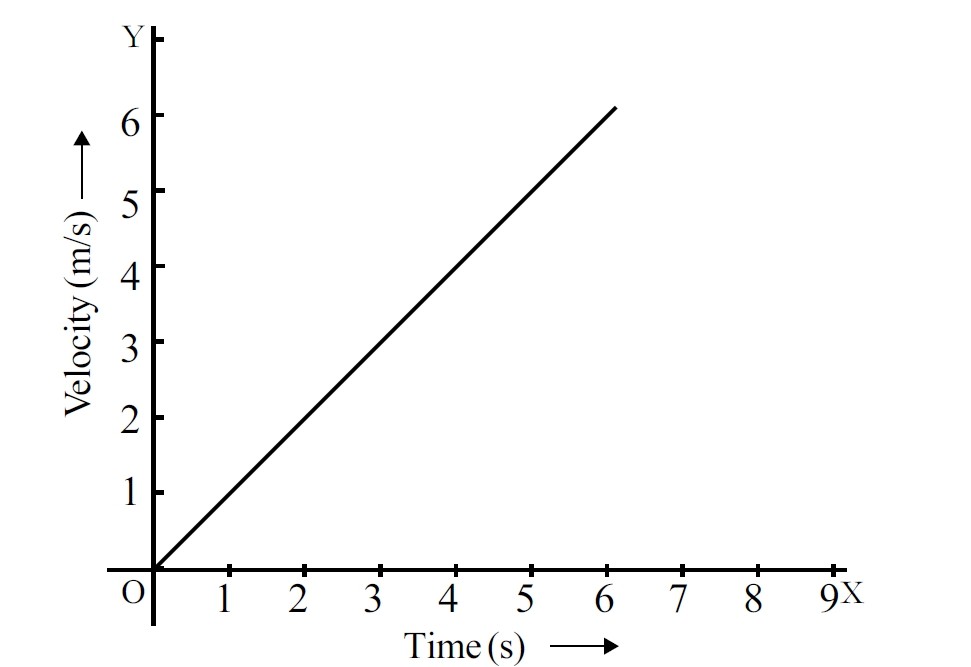
A velocity-time graph can be drawn by taking, on a convenient scale, time on X-axis and velocity on Y-axis. Let’s consider the table below for the velocity and time data sets.
| Time(s) on X-axis | 0 | 1 | 2 | 3 | 4 | 5 |
| Velocity (m/s) on Y-axis | 0 | 1 | 2 | 3 | 4 | 5 |
Take Away
Here we have seen how a common graph paper is used to draw motion graphs like the position-time graph, speed-time graph, and velocity-time graph when a set of corresponding data is available.