
Isotherm, Isobar & Isochore graphs
When we study gas laws (Boyle’s law, Charles’ law & Pressure Law), we come across terms like Isotherm, Isobar, and Isochore. Here, in this post, we will discuss these.
What is Isotherm?
If we draw Boyle’s law graphs at diff temperatures then we get curves shown in figure 1.
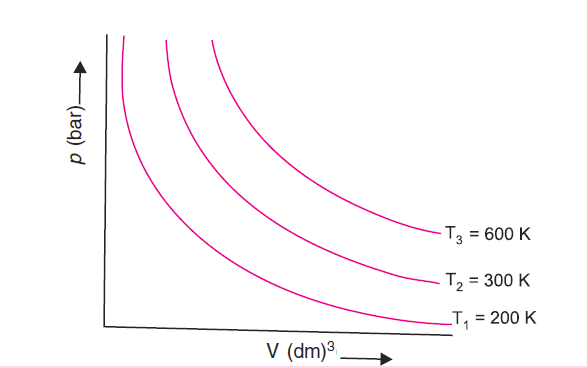
Boyle’s law is expressed as V = k1 / p where V is the volume, p is the pressure of the gas and k1 is a constant of proportionality whose value depends upon the amount of the gas and temperature.
The value of k1 for each curve is different (because for a given mass of gas it varies only with temp).
Each p-V curve of Boyle’s law graphs corresponds to a different constant temperature and is known as an isotherm. Higher curves correspond to higher temp.
What is Isobar?
If we draw Charles’ law graphs at different pressures then we get curves shown in figure 2.
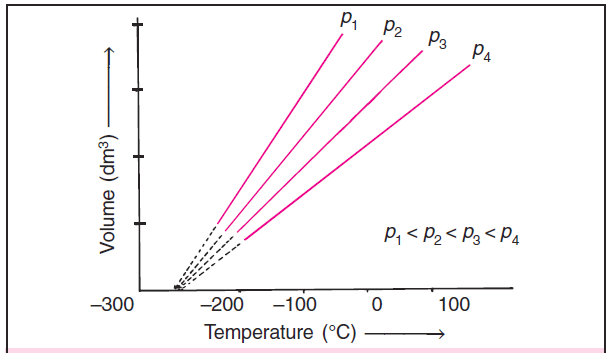
Each curve corresponds to different constant pressure and is known as an isobar.
Charles’ law is expressed as V = k2 T where V is the volume, T is the temperature of the gas and k2 is a constant of proportionality.
These Charles’ law curves are Volume vs temperature (°C) graphs for different pressures.
Each line of the Charles’ law graphs or Volume vs Temperature graphs corresponds to a different constant pressure and is called isobar.
What is Isochore?
If we draw Pressure law graphs at different volumes then we get curves shown in figure 3.
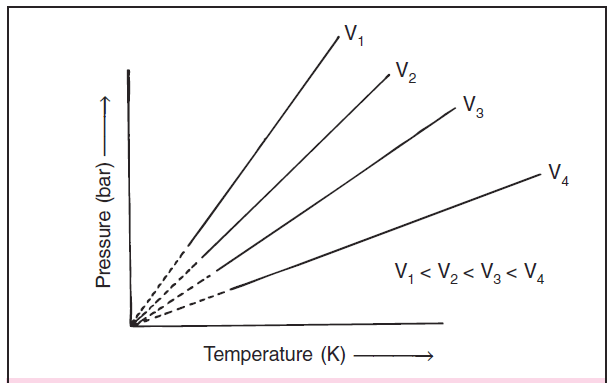
Each curve corresponds to a different constant volume and is known as an isochore.
Pressure law is expressed as P = k3 T where P is the pressure, T is the temperature of the gas and k3 is a constant of proportionality.
These Pressure law curves are Pressure vs temperature (°C) graphs for different volumes.
Each line of the Pressure law graphs or Pressure vs Temperature graphs corresponds to a different constant volume and is called isochore.