
Measurement of coefficients of friction
This post discusses a typical experimental setup for the Measurement of coefficients of friction. As you well know, it’s easier to push an object from one point to another than to carry it from one point to another. We usually just accept this observation as obvious. But why is this so? The observation leads to the conclusion that the force of kinetic friction is usually less than the weight of the object to be moved. If not, why push when you could more easily lift?
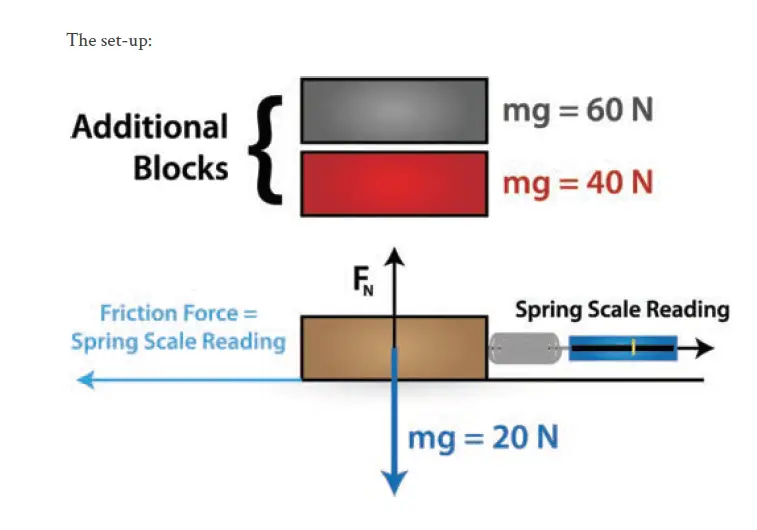
Experimental setup to measure coefficients of friction, μk
The coefficients of friction, μk, are measured experimentally. A typical experimental setup, which is often encountered in school physics laboratories, is to use a spring scale to pull increasing weights at a constant velocity, (see the Figure below).
Since the velocity is constant, that means the net force has to be zero. This also means that the force that the spring scale exerts is equal to the magnitude of the kinetic friction.
As the weight that is pulled increases, so too does the minimum force required to set the weight in motion. But as noted above, we would expect the force reading on the spring scale, to be smaller than the weight being pulled. The ratio of the force on the spring scale to the weight of the object is found to be constant and this ratio is μk.
Results
mg = 20 Newton
Here are 3 sets of reading presented in tabular format. As the weight increases, the friction also increases. For all 3 readings if you take the ratio of frictional force and weight we get the same value, 0.5.
| Weight (Newton) | Spring reading = friction force (Newton) |
| 20 | 10 |
| 40 | 20 |
| 60 | 30 |
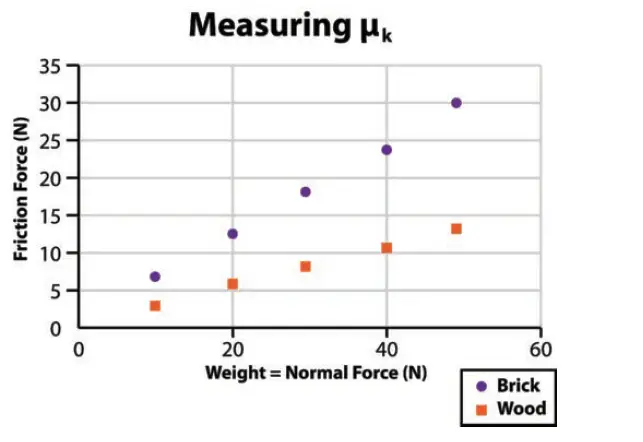
Graphical representation of kinetic friction force vs. weight to measure μk
If we graph kinetic friction force vs. weight, we would find a straight line with a slope of 0.5. The slope of this graph represents the coefficient of friction, μk.
Notice that friction is measured in newtons since it is a force.
The figure below shows two experiments measuring the coefficient of kinetic friction for brick and wood on polished oak.
So, in this post, we have covered the Experimental setup to measure coefficients of friction, μk, and we also analyzed its results and graphs. Also, if you like this post, please read this interesting post on friction & walking.