
Longitudinal Wave Graphical Representation
In this post, we will study Longitudinal Wave Graphical representation. Here, we will see how the Density-Distance graph graphically represents a Longitudinal Wave.
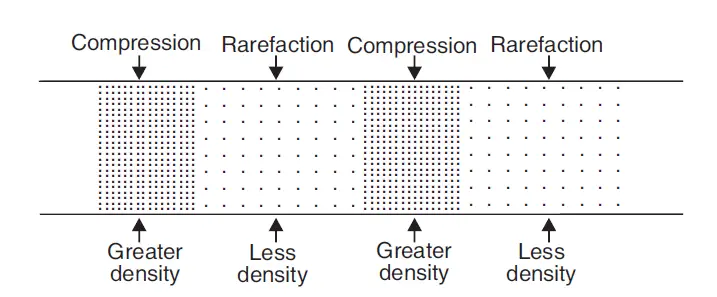
When a Longitudinal Wave, say a sound wave passes through the air, the particles of air vibrate back and forth parallel to the direction of the sound wave. Thus, when a Longitudinal Wave travels in the horizontal direction, then the particles of the medium also vibrate back and forth in the horizontal direction.
When a longitudinal wave passes through a medium, say air, then some of the particles of air get crowded together and form compression, whereas other particles go farther apart and form a rarefaction.
So, a longitudinal wave is represented pictorially by showing the compressions and rarefactions.
Now, let’s see how a density-distance graph can represent the compression and rarefaction of a longitudinal wave.
Density-Distance graph to graphically represent Longitudinal Wave
In a compression, the density of the medium, say air, is high whereas in a rarefaction, the density of the medium is low. Thus, when a longitudinal wave passes through the medium, then the density of the medium changes continuously.
So, a longitudinal wave in an air medium is represented graphically by plotting the density of air against the distance from the source. In other words, a longitudinal wave is represented by a density-distance graph (see figure 2).
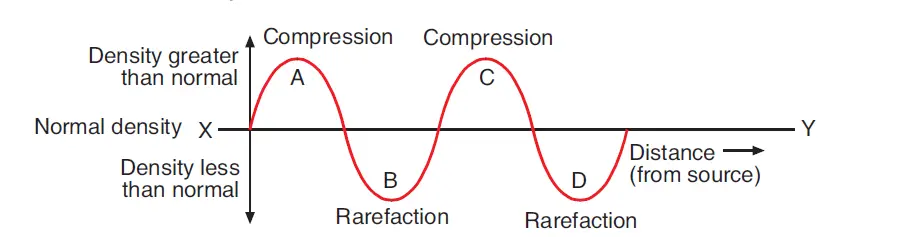
Please note that the wavy line in Figure 2 which represents a longitudinal wave in air, actually shows the variation of the density of air as the longitudinal wave passes through it.
In the Density-Distance graph in Figure 2, the horizontal line XY represents the normal density of air. All the points above this line represent greater density and those below this line represent less density of air than normal.
So, here A and C represent compressions whereas B and D represent rarefactions.
A longitudinal wave in the air is graphically represented by means of a density-distance graph as shown in Figure 2.