
Calculating the Energy stored in a deformed material
Last updated on November 5th, 2021 at 03:37 am
Here, we will see how the Load-extension graph of a body can help us to calculate the energy stored in a deformed material. We will take two Load-extension graphs for this.
Energy stored in a deformed material that obeys Hooke’s law
The first load-extension graph (figure 1a) belongs to a body that obeys Hooke’s law, i.e., extension is proportional to the load.
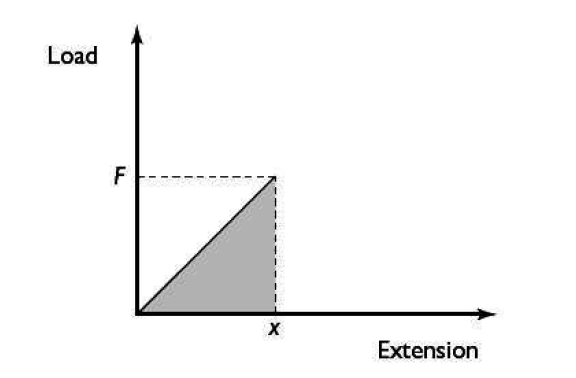
The work done in stretching the body is equal to force multiplied by the distance moved.
This is equal to the strain potential energy in the body. The force is not, however, F the maximum force, rather it is the average force, which is F/2.
Hence Strain energy = elastic potential energy = (1/2) F x. This is the area of the triangle under the graph.
Energy stored in a deformed material that doesn’t obey Hooke’s law
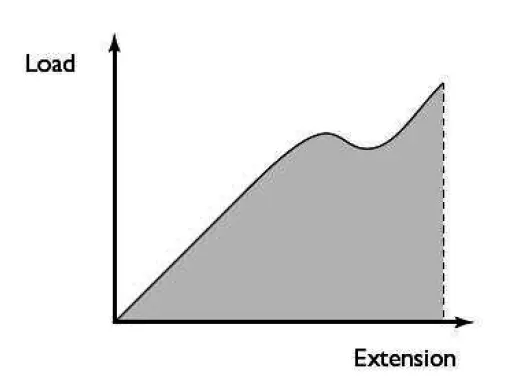
The general rule, Even when the extension is not proportional to the load (as shown in figure 1b), is:
strain energy = area under the load-extension graph
strain energy or the elastic potential energy = (1/2) k x2
We have seen that, Strain energy = elastic potential energy = (1/2) F x.
It is worth noting that by substituting for F (= kx) in the original equation, it can be rewritten as:
strain energy = (1/2) k x2
This form of the equation shows us that the energy stored in the spring is proportional to the square of the extension – rather than just the extension itself.
This means that if the extension is doubled the energy stored is quadrupled, if the extension is tripled the energy stored is multiplied by nine etc.
elastic hysteresis
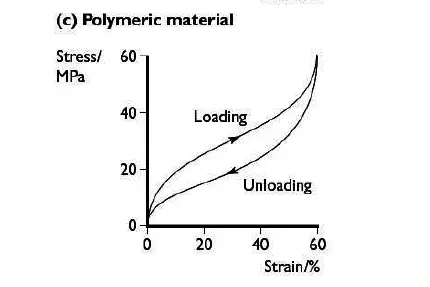
If you consider the load-extension graph in figure 2, you can see that the area under the graph when loading is larger than when unloading the wire.
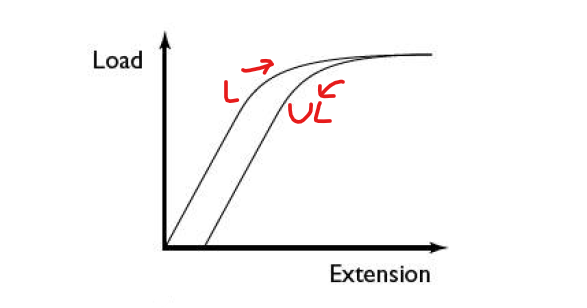
The area under the graph when loading the wire > Area under the curve when unloading the wire
This means that more energy is stored in the stretched wire than is released when the load is removed.
The energy that got stored in the stretched or loaded wire > Energy that gets released as the load from the wire is removed
What happens to the rest of the energy? It is converted to internal energy in the wire – hence the temperature of the wire increases.
The energy that is converted to internal energy in the wire is equal to the area in the enclosed loop made by the loading and unloading curves. This is known as elastic hysteresis.
Deformation of Different materials
Different materials deform differently under stress. The stress-strain graphs below show some examples.
Deformation of Brittle materials
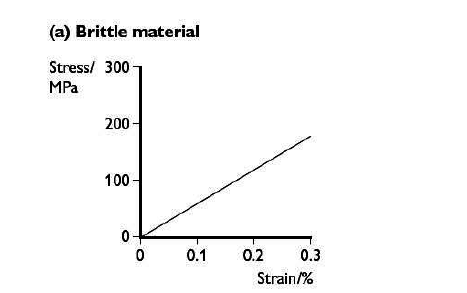
Brittle materials break at their elastic limit, with very little plastic deformation.
Glass is a brittle material. It is surprisingly strong and has ultimate tensile stress (the maximum tensile or stretching stress that a material can withstand before fracture) of about 150MPa. However, this varies widely because any small cracks on the surface will rapidly widen and reduce its strength.
Deformation of Ductile materials
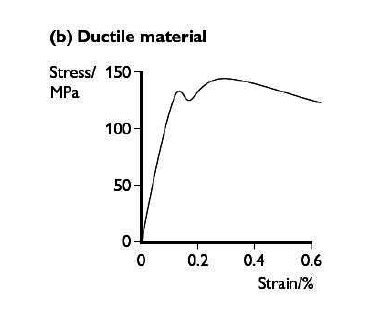
Ductile materials initially stretch elastically obeying Hooke’s law. However, once they reach their elastic limit they stretch much more per unit increase in load. They reach a point at which they continue to stretch, even if the load is reduced slightly.
They then break. Most pure metals are ductile. Copper is a good example. It has about the same ultimate tensile stress as glass (150 MPa) but it stretches much more.
Deformation of Polymeric materials
Polymeric materials are highly temperature-dependent. At low temperatures, they can act as brittle materials. At higher temperatures, their behavior changes dramatically.
Note that there is no standard shape of the graph for polymerics; different polymers behave in different ways. Diagram (c) above shows the graph for rubber.